public 3d-motion repository
EduNation
// Zaid-Ahmed-Ansari/EduNation
🌍 NationHub — A full-stack interactive geopolitical analytics and policy simulation platform. Explore real-time country data, compare nations side-by-side, and simulate policy impacts with an immersive 3D globe interface. Built with React, Three.js, Express, Supabase & Redis.




📖 Table of Contents
- 🔗 Check it Live
- 🎯 Why EduNation?
- 👥 Who is this for?
- ✨ Feature Preview
- 🚀 Core Features
- 🧠 Architecture Overview
- 🛠️ Tech Stack
- ⚡ Quick Start
- 🐳 Docker Services
- 🟢 Good First Issues
- 🤝 Contributing
- ❤️ Support EduNation
🔗 Check it Live
Explore the fully interactive 3D globe and simulate policy impacts directly from your browser. (Note: Initial load may be slow as we are currently using free-tier hosting for the API.)
🎯 Why EduNation?
EduNation was built to make global policy and economic data interactive, intuitive, and exploratory — enabling students, researchers, and curious minds to simulate "what if" scenarios and understand how nations evolve over time.
👥 Who is this for?
- Students learning economics, geopolitics, or data analysis
- Developers interested in data visualization and simulations
- Researchers exploring country-level trends
- Anyone curious about "what if" macro-policy scenarios
✨ Feature Preview
3D Interactive Globe
 Click any country to explore
Analytics Dashboard
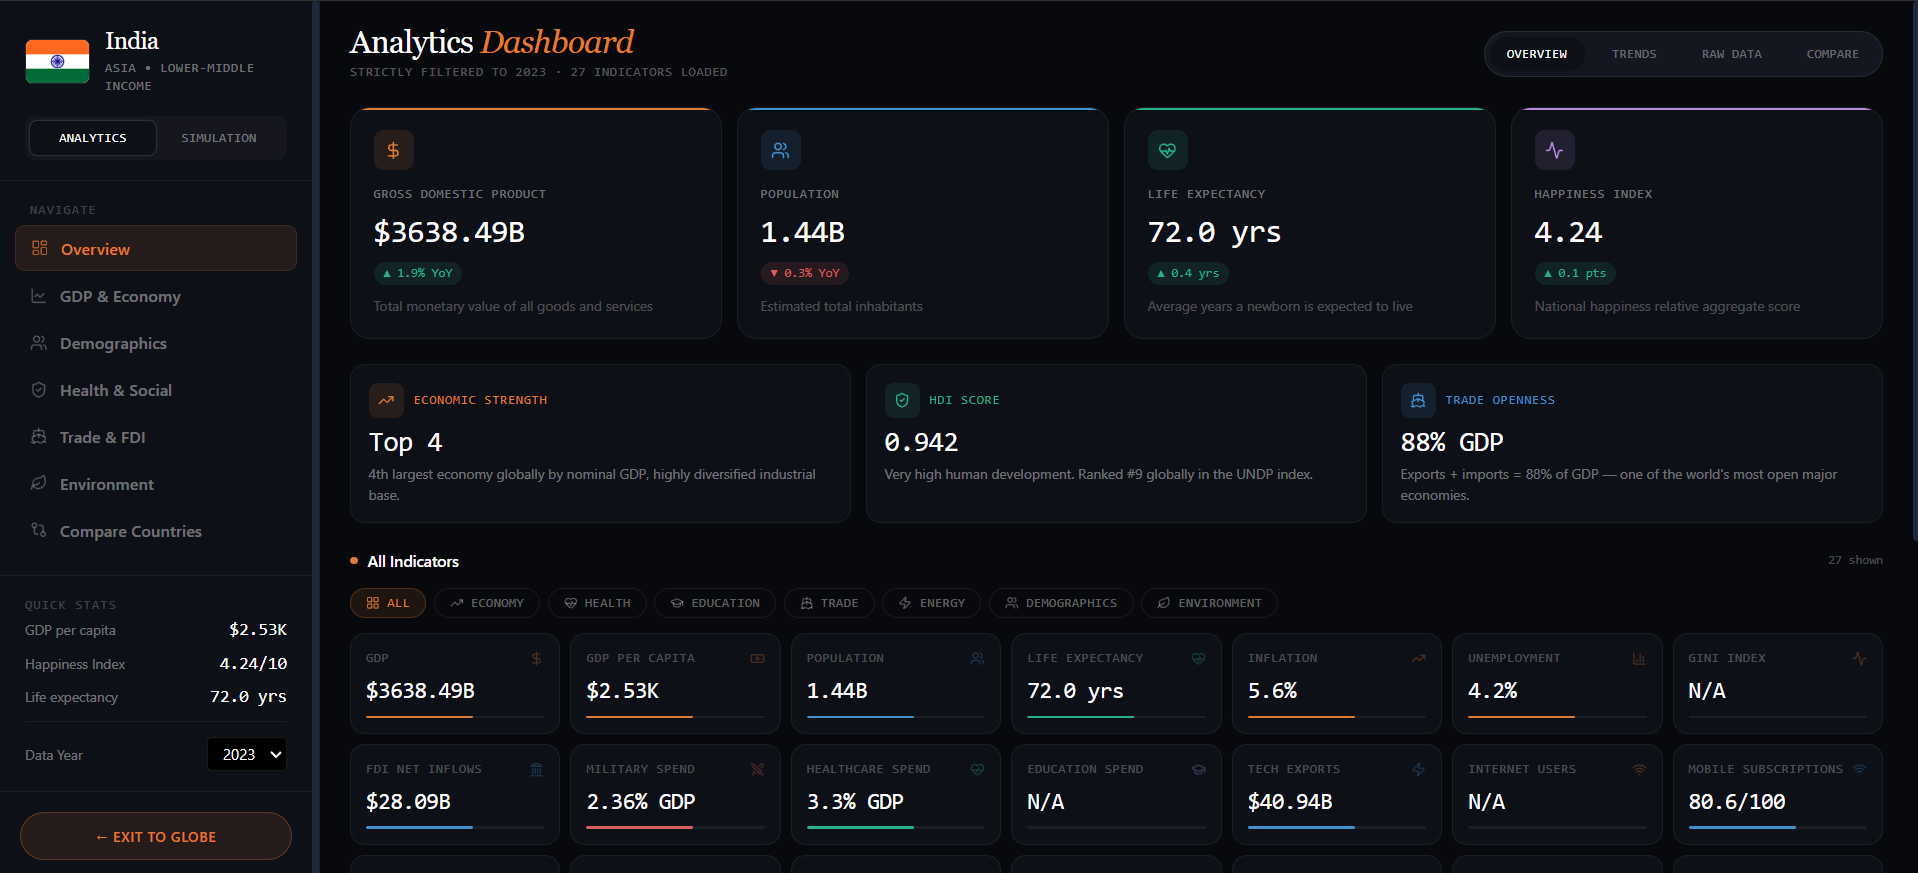 25+ real-time indicators
Policy Simulation
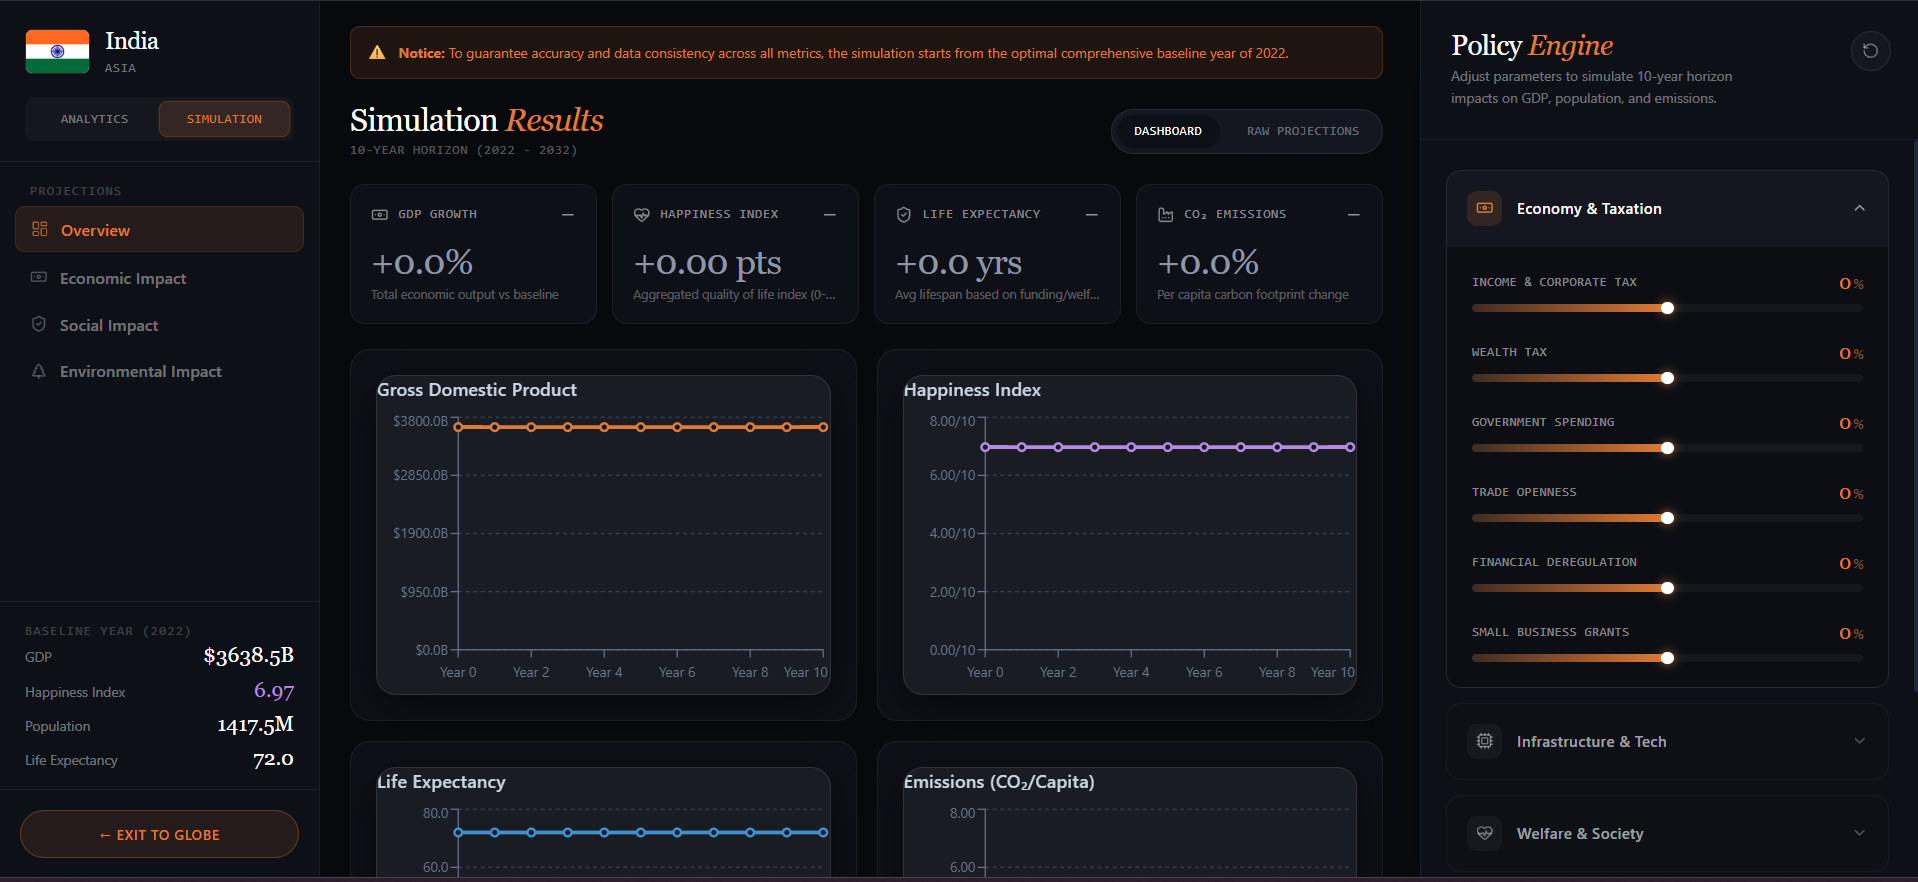 Adjust 25 policy sliders
Cross-Country Comparison
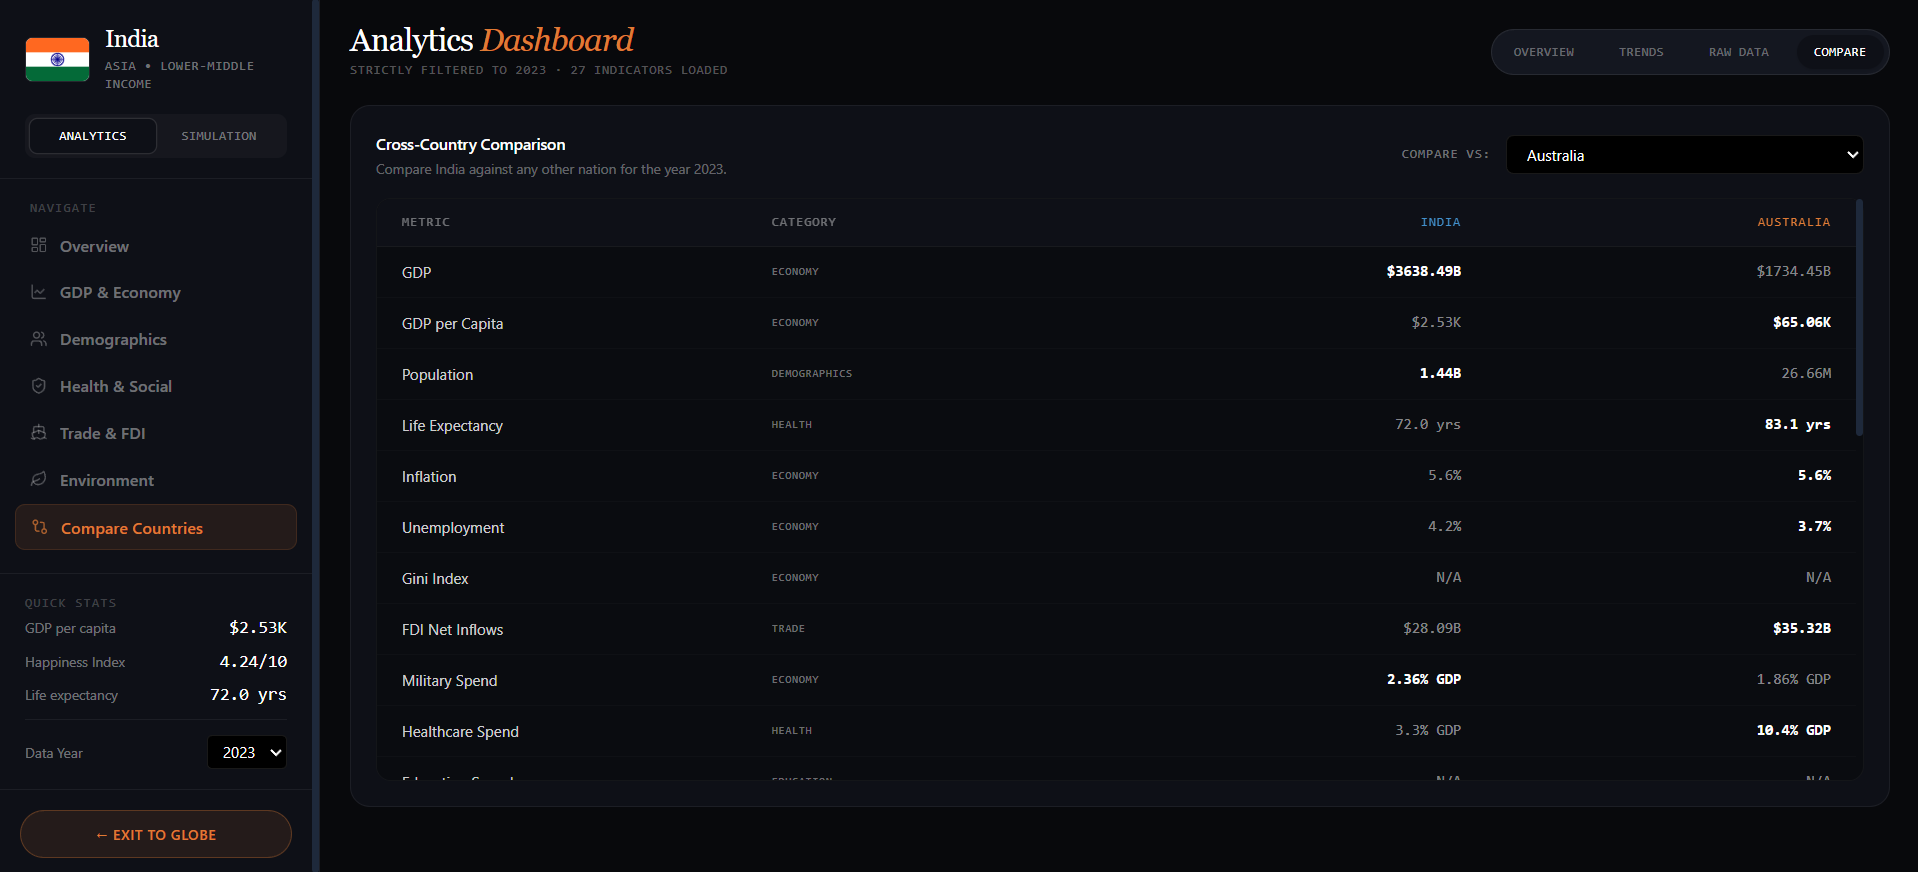 Side-by-side nation analysis
🚀 Core Features
🌐 Interactive 3D Globe
- Photorealistic Earth rendered with Three.js & React Three Fiber
- Click any country to navigate directly to its analytics dashboard
- Smooth camera transitions and hover-to-label interactivity
📊 Analytics Dashboard
- 25+ real-time economic indicators sourced from the World Bank API
- Happiness Index from the official World Happiness Report (2009–2024)
- Data Year selector — lock all metrics to any year from 2000–2024
- Progressive loading — dashboard shell loads instantly, individual metrics show spinners
- Category filters: Economy, Health, Education, Trade, Energy, Demographics, Environment
- GDP trend charts (nominal & inflation-adjusted), bar comparisons, and raw data inspector
⚖️ Policy Simulation Engine
- 25 policy sliders including tax rate, healthcare, UBI, carbon tax, space program, and more
- Projects GDP, life expectancy, CO₂ emissions, population, and happiness over 10 years
- Baseline alignment warning ensures data consistency across all simulated metrics
- Real-time interactive charts update as you drag sliders
🔍 Cross-Country Comparison
- Compare any two nations side-by-side across all 25+ indicators
- Visual polarity cues — better values are highlighted in bold
- Respects the selected Data Year for both countries
🏗️ Three-Tier Caching Architecture
- Redis (Upstash) → PostgreSQL (Supabase) → External API waterfall
- Once any user fetches a country's data, it's cached in Redis for instant access
- Persistent fallback in Supabase's
api_cachetable - Dramatically reduces API calls and improves response times
🧠 Architecture Overview
Frontend (React) → Backend (Express) → Redis Cache → PostgreSQL → External APIs
- User Request: The React frontend requests country data.
- Tier 1 (Redis): The Express backend checks Upstash Redis. If a hit, data is returned instantly (~50ms).
- Tier 2 (PostgreSQL): On a Redis miss, it queries the Supabase
api_cachetable. If found, it backfills Redis and returns data (~200ms). - Tier 3 (External API): If no database record exists, it fetches from the World Bank/REST Countries external APIs, parses the data, saves to Supabase, sets Redis, and returns it.
🛠️ Tech Stack
Frontend
| Technology | Purpose |
|---|---|
| React 19 | UI framework |
| TypeScript | Type safety |
| Vite | Build tool & dev server |
| Three.js + React Three Fiber | 3D globe rendering |
| TanStack Query | Async state management & caching |
| Zustand | Global state (lightweight) |
| Recharts | Charts & data visualization |
| Tailwind CSS 4 | Utility-first styling |
| Lucide React | Icons |
| GSAP | Scroll animations |
Backend
| Technology | Purpose |
|---|---|
| Express 5 | REST API server |
| TypeScript | Type safety |
| Supabase | PostgreSQL database + auth |
| Upstash Redis | Serverless Redis caching |
| Axios | HTTP client for external APIs |
Data Sources
| Source | Data |
|---|---|
| World Bank API | 25 economic/social indicators |
| REST Countries | Country metadata, flags, borders |
| World Happiness Report | Happiness Index (2009–2024) |
| Our World in Data | CO₂ emissions history |
📁 Project Structure
edunation/
├── .gitignore                  # Root gitignore
├── LICENSE                     # MIT License
├── CONTRIBUTING.md             # Contribution guidelines
├── CODE_OF_CONDUCT.md          # Contributor Covenant
├── README.md                   # ← You are here
├── schema.sql                  # Full database schema
├── DATABASE_SCHEMA.MD          # Schema documentation
│
├── backend/
│   ├── .env.example            # Environment variable template
│   ├── package.json
│   ├── tsconfig.json
│   └── src/
│       ├── index.ts            # Express server entry point
│       ├── config/
│       │   ├── supabase.ts     # Supabase client init
│       │   └── redis.ts        # Upstash Redis client init
│       ├── controllers/
│       │   ├── countryController.ts    # Country + indicators endpoints
│       │   └── simulationController.ts # Simulation + rankings endpoints
│       ├── routes/
│       │   ├── index.ts        # Route aggregator
│       │   └── countryRoutes.ts# All API route definitions
│       ├── services/
│       │   ├── worldBank.service.ts    # WB API (Redis→DB→API flow)
│       │   ├── restCountries.service.ts# REST Countries API
│       │   ├── owid.service.ts         # Our World in Data API
│       │   └── geo.service.ts          # GeoJSON service
│       ├── utils/
│       │   └── cache.ts        # Multi-tier caching utility
│       ├── data/
│       │   ├── unified_happiness.json  # Happiness 2009–2024
│       │   └── owid_co2.json           # Pre-cached CO₂ emissions
│       └── scripts/
│           └── ingest.ts               # Full DB population script
│
└── frontend/
    ├── .env.example            # Environment variable template
    ├── package.json
    ├── index.html
    ├── vite.config.ts
    └── src/
        ├── main.tsx            # React entry point
        ├── App.tsx             # Root component + routing
        ├── index.css           # Global styles
        ├── api/
        │   └── index.ts        # Axios API client
        ├── components/
        │   ├── 3d/Globe.tsx            # Three.js globe component
        │   ├── layout/SearchOverlay.tsx # Country search UI
        │   ├── simulation/
        │   │   ├── PolicyPanel.tsx      # 25-slider policy panel
        │   │   └── ProjectionChart.tsx  # Simulation result charts
        │   └── ui/                     # Reusable UI primitives
        ├── pages/
        │   ├── LandingPage.tsx         # Hero + 3D globe landing
        │   ├── AnalyticsDashboard.tsx   # Full analytics view
        │   ├── SimulationDashboard.tsx  # Policy simulation view
        │   └── ReferencePage.tsx        # Reference/about page
        ├── simulation/
        │   └── engine.ts       # Simulation computation engine
        ├── store/
        │   ├── uiStore.ts      # UI state (Zustand)
        │   └── simulationStore.ts # Simulation state (Zustand)
        └── utils/
            └── formatters.ts   # Number/currency formatters
⚡ Quick Start
Prerequisites
- Docker Desktop with Docker Compose
1. Clone the Repository
git clone https://github.com/zaid-ahmed-ansari/EduNation.git
cd EduNation
2. Start the Full Stack (Docker)
docker compose up -d --build
This starts all required containers (frontend, backend, postgres, redis) and runs schema initialization automatically before the backend starts.
Note: For local Docker development, you do not need to create or edit backend .env. Development environment variables (including NODE_ENV=development) are already provided in docker-compose.yml.
3. (Optional) Seed Data
If you want local Postgres to contain preloaded indicator data:
docker compose exec backend npx tsx src/scripts/ingest.ts
4. Open in Browser
Navigate to http://localhost:5173 and explore the globe! 🌍
5. Useful Docker Commands
# View running services
docker compose ps

# View backend logs
docker compose logs -f backend

# Stop everything
docker compose down

# Stop and remove volumes (fresh DB/Redis)
docker compose down -v
🐳 Docker Services
EduNation runs with these services in docker-compose.yml:
frontend(edunation-frontend): Vite React app onhttp://localhost:5173backend(edunation-backend): Express API onhttp://localhost:5000postgres(edunation-postgres): PostgreSQL 16 onlocalhost:5432redis(edunation-redis): Redis 7 onlocalhost:6379db-init(edunation-db-init): one-time schema bootstrap job that applies SCHEMA.SQL if tables are missing
Schema bootstrap logic lives in scripts/init-db.sh.
🟢 Good First Issues
- Improve UI responsiveness on smaller mobile screens
- Add more countries to the simulation baseline dataset
- Enhance React chart performance for large datasets
- Improve caching strategy documentation inside the codebase
🤝 Contributing
We welcome contributions! Please read our Contributing Guidelines and Code of Conduct before getting started.
- Fork the project
- Create your feature branch (
git checkout -b feat/amazing-feature) - Commit your changes (
git commit -m 'feat: add amazing feature') - Push to the branch (
git push origin feat/amazing-feature) - Open a Pull Request
📄 License
Distributed under the MIT License. See LICENSE for details.
🙏 Acknowledgments
- World Bank Open Data for economic indicators
- World Happiness Report for happiness index data
- REST Countries for country metadata
- Our World in Data for environmental data
- Supabase for the database platform
- Upstash for serverless Redis

[INFO] 2 topics link to curated motion topic pages.